


import matplotlib.pyplot as plt
import numpy as np
from scipy.ndimage import gaussian_filter
# 从 CSV 文件加载数据
data = []
with open("test.000_20250426_215019.analysis.csv", "r") as file:
next(file) # 跳过头部
for line in file:
if line.strip():
parts = line.strip().split(",")
frame_idx = int(parts[1])
in_x = float(parts[9]) if parts[9] else None
in_y = float(parts[10]) if parts[10] else None
if in_x is not None and in_y is not None:
data.append((frame_idx, in_x, in_y))
# 分离坐标
frames, x_coords, y_coords = zip(*data)
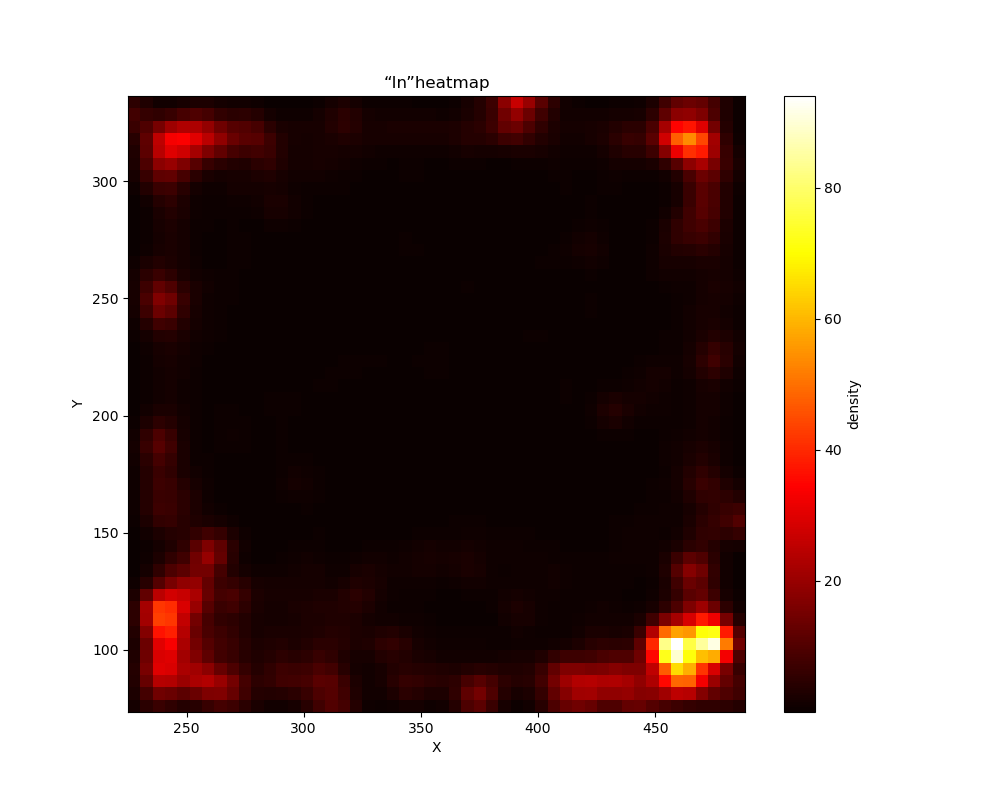
# 创建热图
heatmap, xedges, yedges = np.histogram2d(x_coords, y_coords, bins=50)
heatmap = gaussian_filter(heatmap, sigma=1)
plt.figure(figsize=(10, 8))
plt.imshow(heatmap.T, origin='lower', cmap='hot', interpolation='nearest', extent=[xedges[0], xedges[-1], yedges[0], yedges[-1]])
plt.colorbar(label='density')
plt.title('“In”heatmap')
plt.xlabel('X')
plt.ylabel('Y')
plt.savefig('heatmap.png')
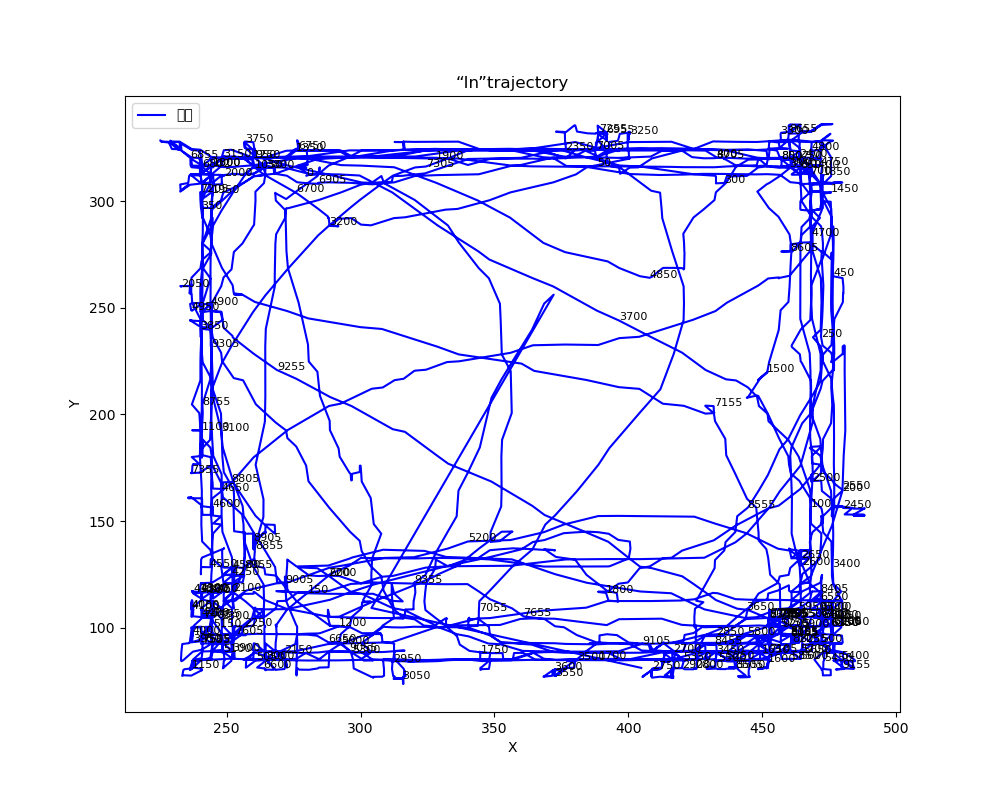
# 创建轨迹图
plt.figure(figsize=(10, 8))
plt.plot(x_coords, y_coords, 'b-', label='轨迹')
for i, (x, y) in enumerate(zip(x_coords, y_coords)):
if i % 50 == 0: # 每50个点标注一次以避免混乱
plt.text(x, y, str(frames[i]), fontsize=8)
plt.title('“In”trajectory')
plt.xlabel('X')
plt.ylabel('Y')
plt.legend()
plt.savefig('trajectory.png')
plt.close()示例
评论区